ePlant
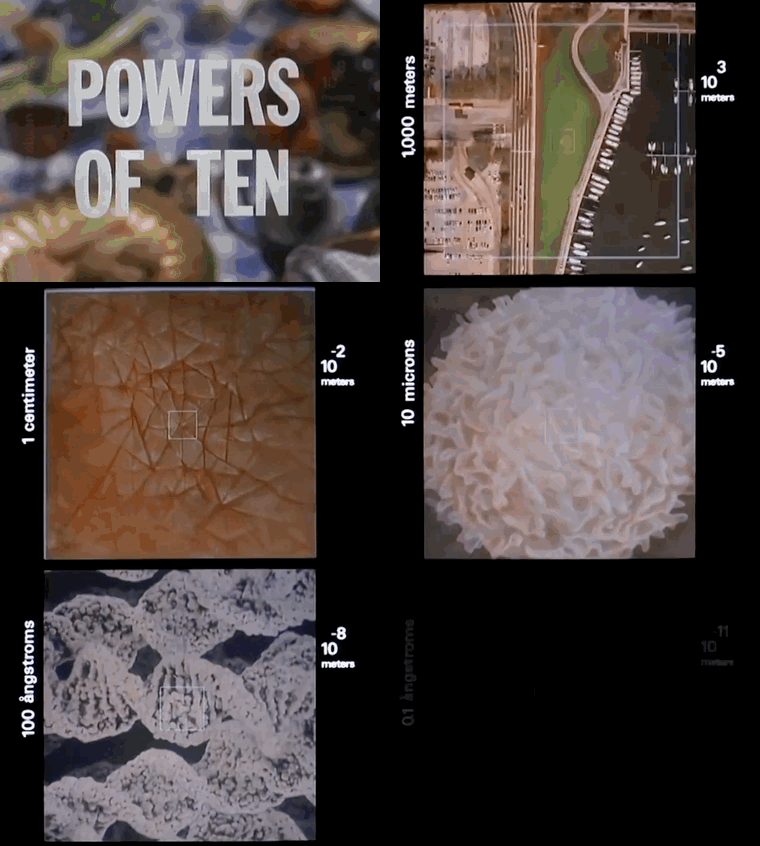
My main dissertation project was inspired by the short film Powers of Ten, by Charles & Ray Eames. I wanted to make a tool that helps biologists visualize data at multiple levels of analysis.
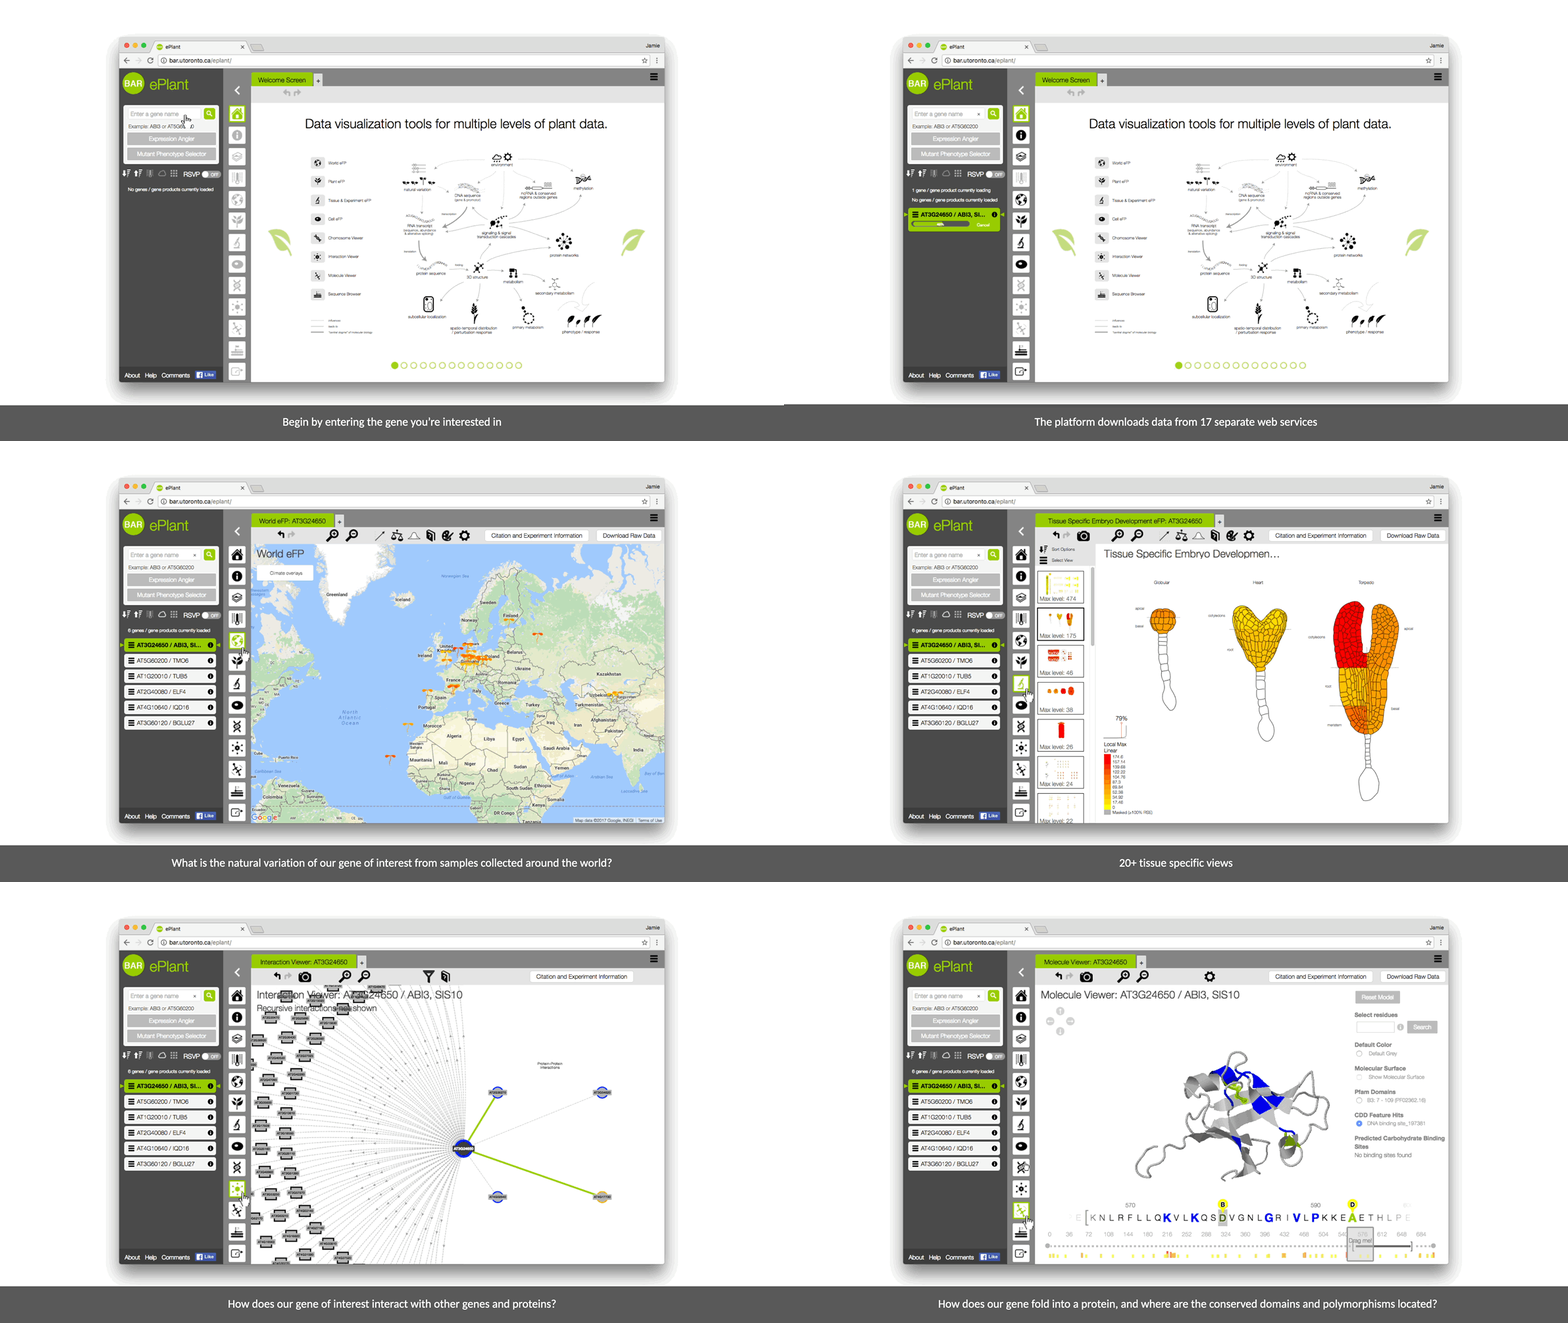
ePlant helps plant biologists find the natural connections between DNA sequences, natural variation, molecular structures, protein-protein interactions, and gene expression patterns.
It downloads the latest genome, interactome, and transcriptome data for any gene or gene product you’re interested in. And it visualizes that data with a set of tools that are presented with a conceptual hierarchy from big to small.
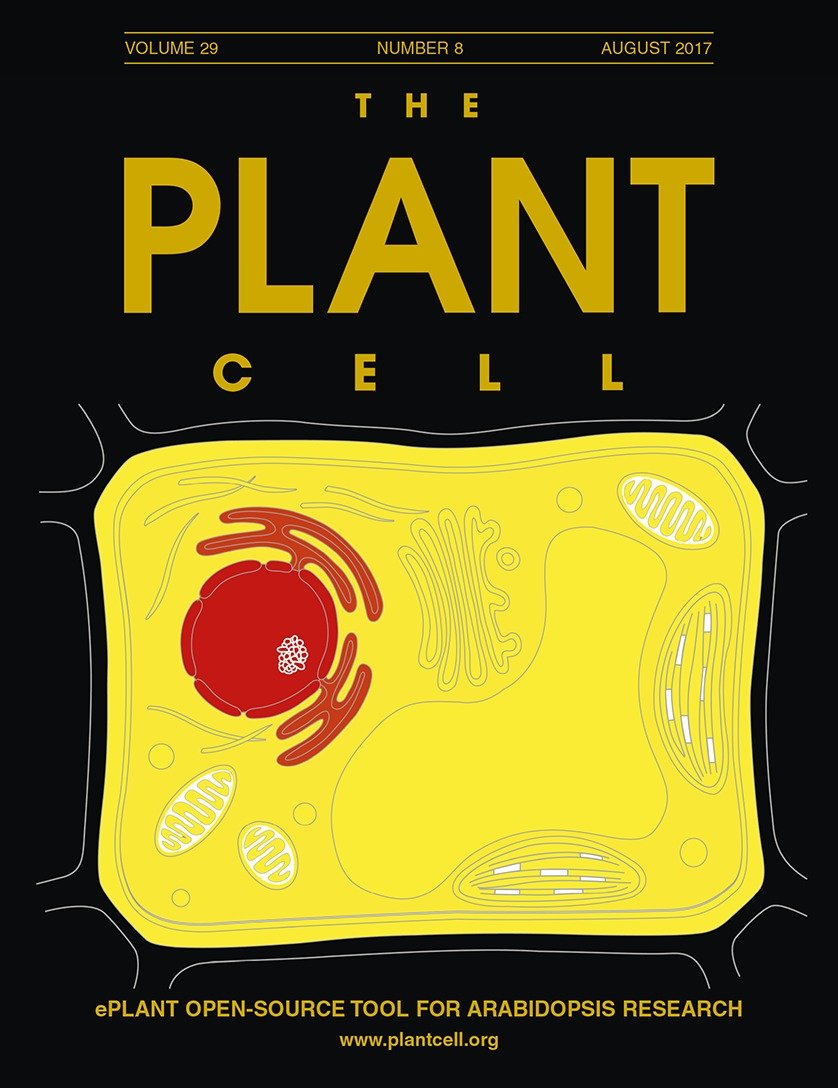
ePlant was featured on the cover of The Plant Cell in August 2017. Read the paper here.
And a brief introduction written by The Plant Cell Science Editor.
The Powers Of Ten is a visualization of the world at multiple layers of analysis
It’s difficult to describe a complex organism when you’re only looking at one layer of analysis at a time.
There are natural connections between different layers of analysis.
Problem statement
Biology researchers need to learn and use many tools in order to generate hypotheses about how life works. But hypothesis generation is a creative process, and it is difficult to be creative when it takes so much time to find, download, transform and manipulate the data you need to follow a hunch.
Proposed work
Build a platform that automates many of the data science tasks that are a pain point for plant biologists.
Success criteria
Users can find genes of interest, explore multiple levels of data and see connections between them, from the kilometer-to-nanometer level, in 20 seconds or less.
User stories
Researcher
“I want to find connections between multiple layers of data so I can develop hypotheses about how living organisms work.”
Educator
“I want my students to see how different areas of research relate to each other and make it easy for them to explore large data sets.”
Student
“I want to be able to answer questions about my gene of interest without having to collate information from multiple sources.”
Vision statement
We envision a collection of data visualization tools that share a common interface, presented with a conceptual hierarchy of biological layers of analysis from big to small. Links between the different views will help underscore connections between different levels of analysis.
This conceptual mockup was included in the initial Genome Canada grant application, and it served as a north star for the development process.
Iterative design process
I didn’t know very much about biology when I began this project so I audited two biology courses at the University of Toronto. I also joined two research labs and worked with the professors and graduate students to understand their research workflows and data visualization pain points.
At these lab meetings, I shared designs for new data visualization tools and got feedback on my prototypes that informed subsequent iterations.
User testing
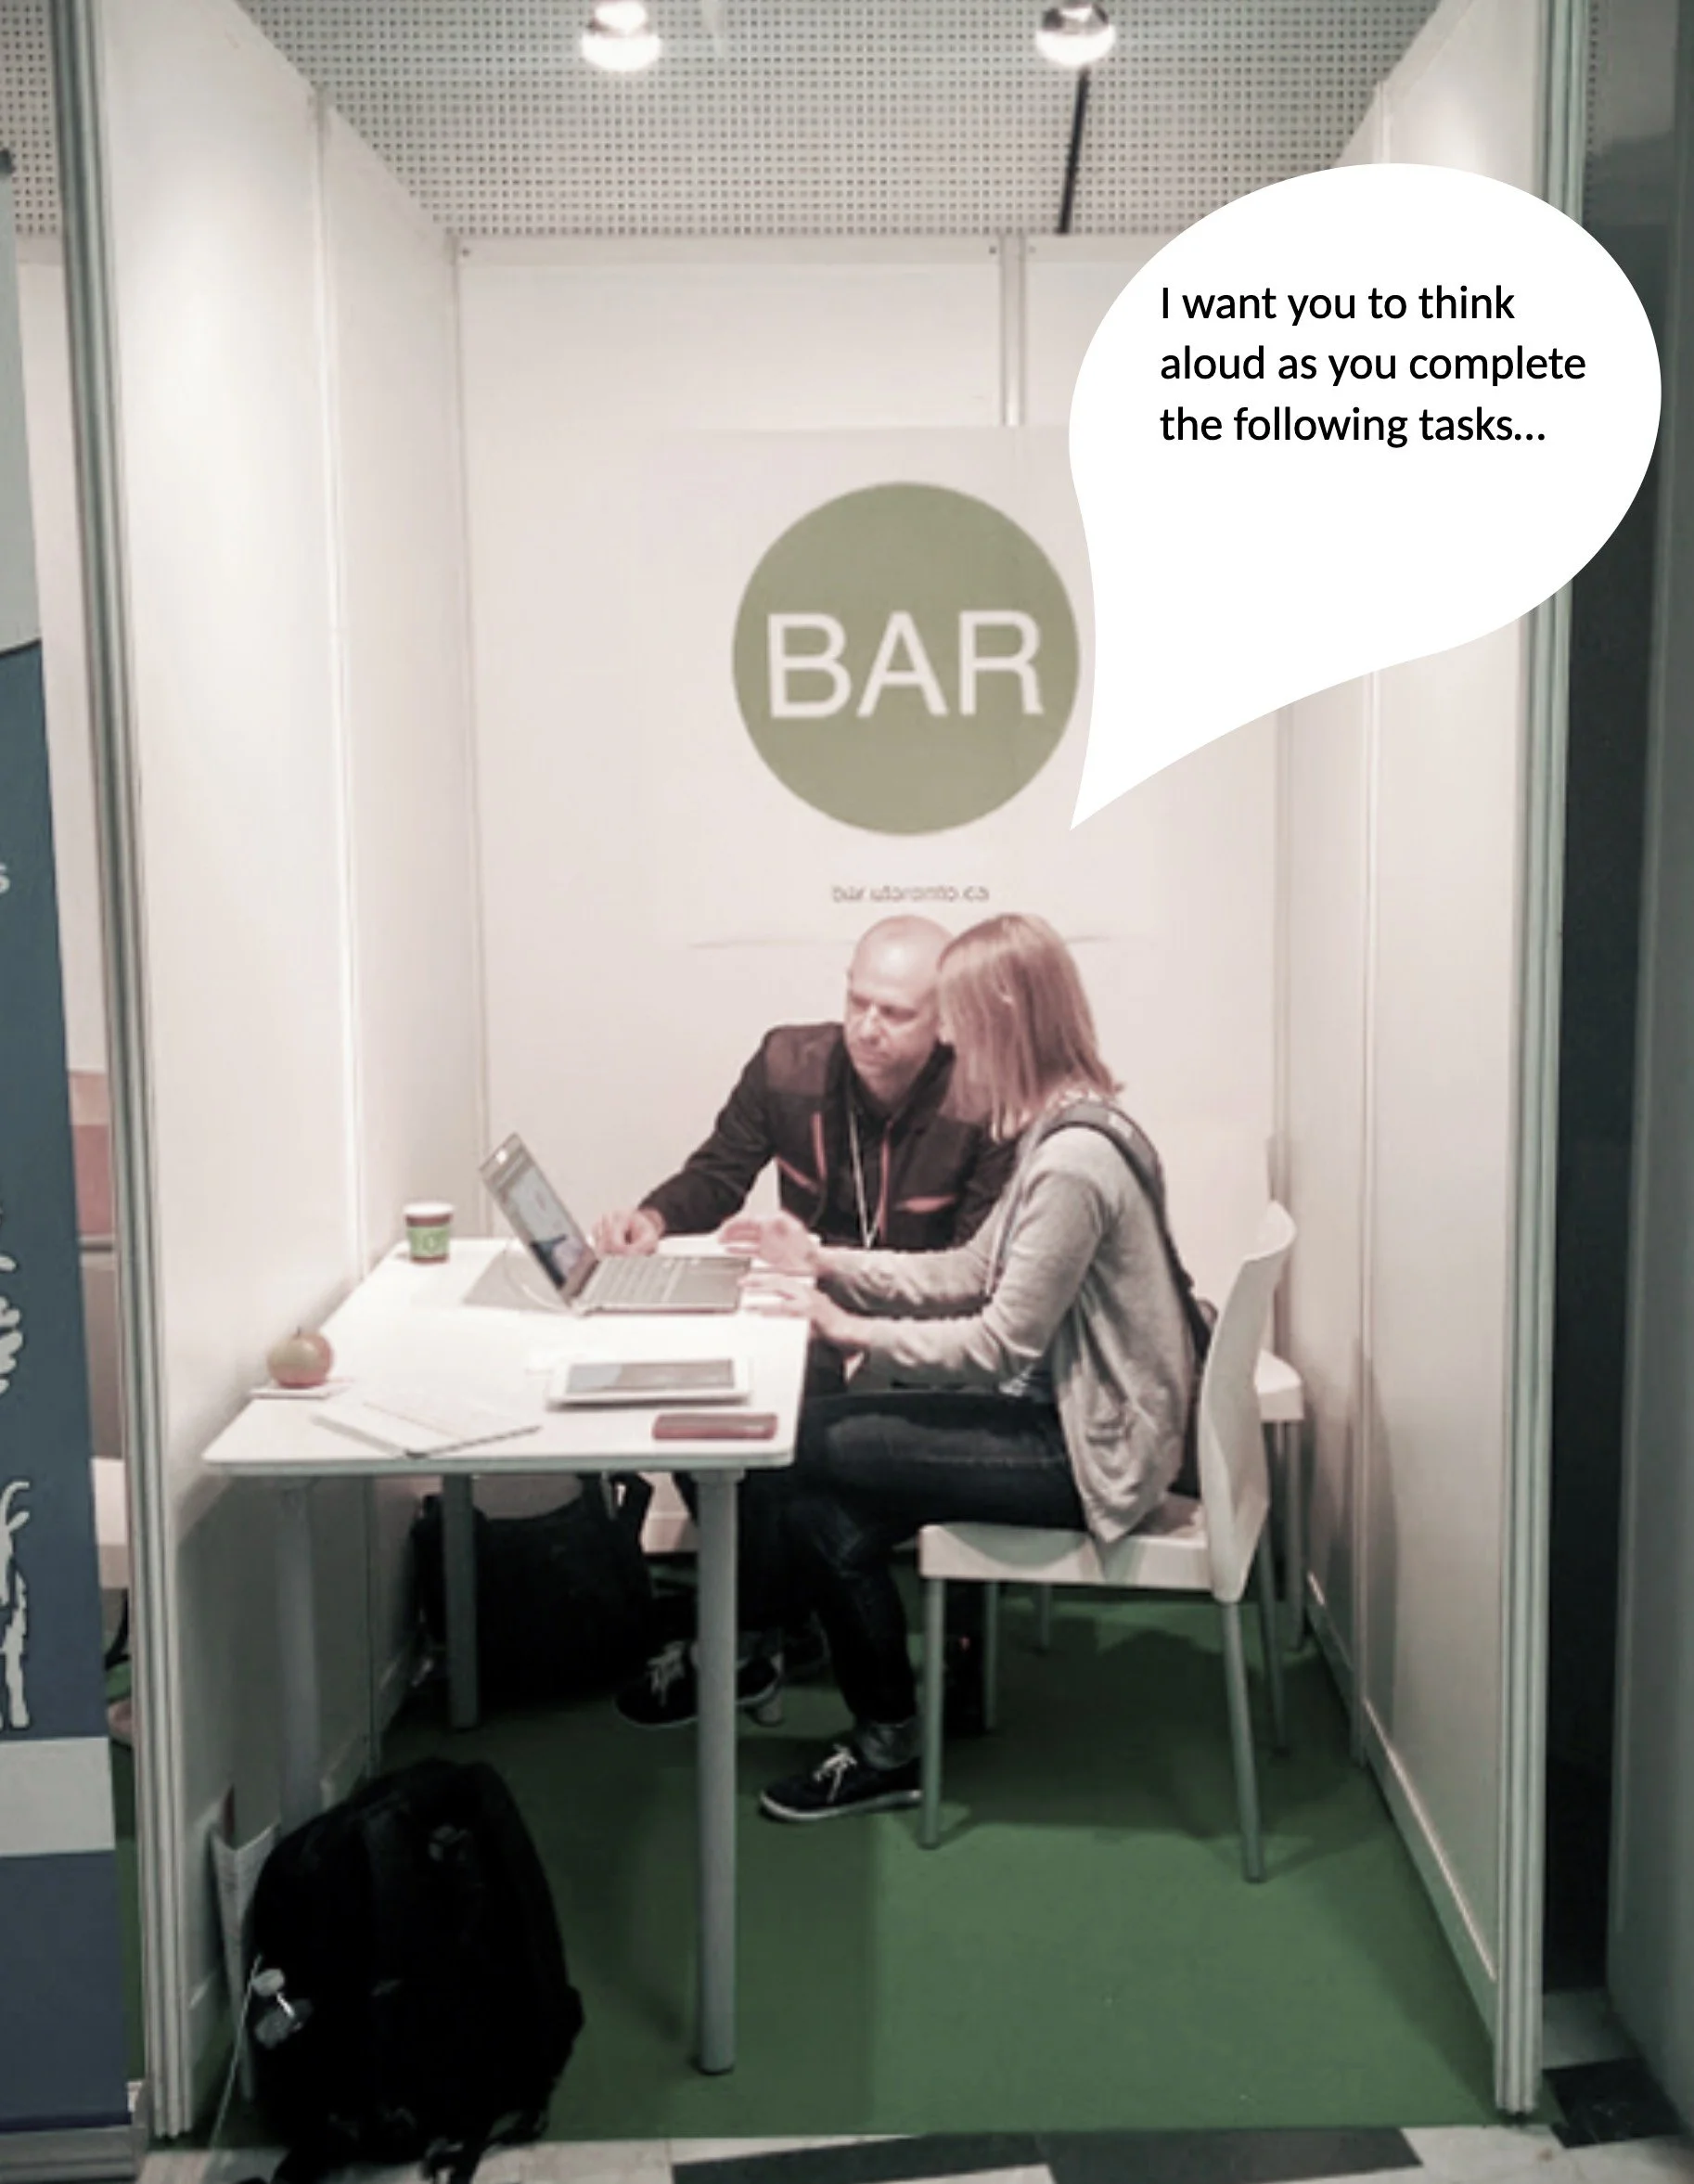
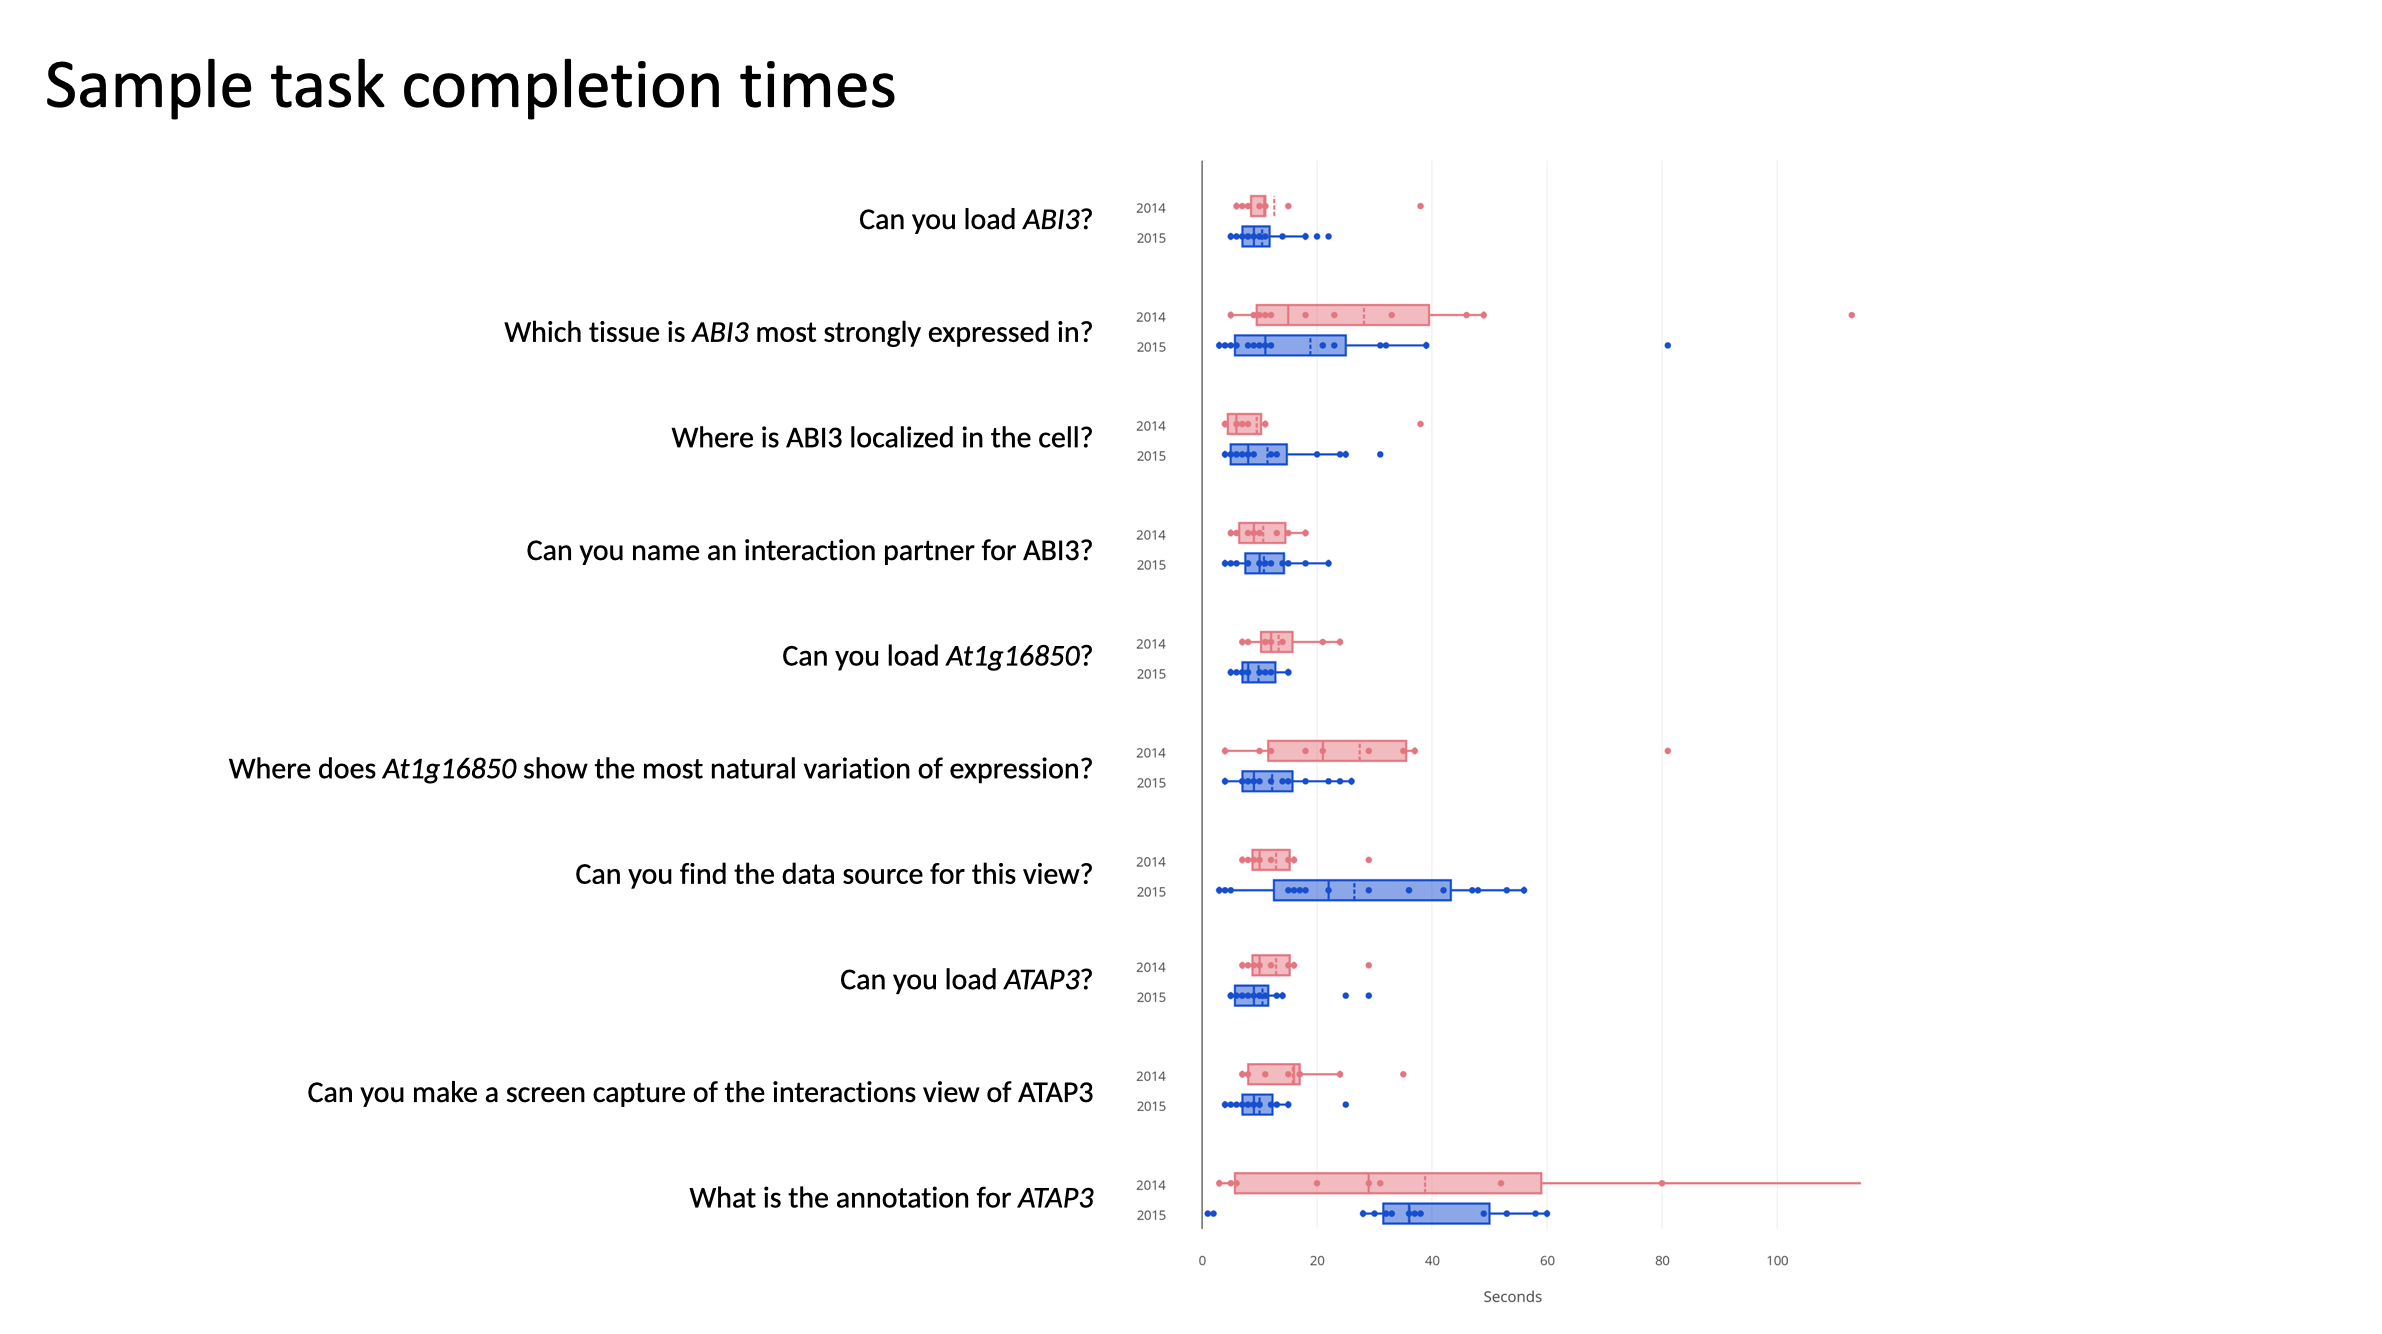
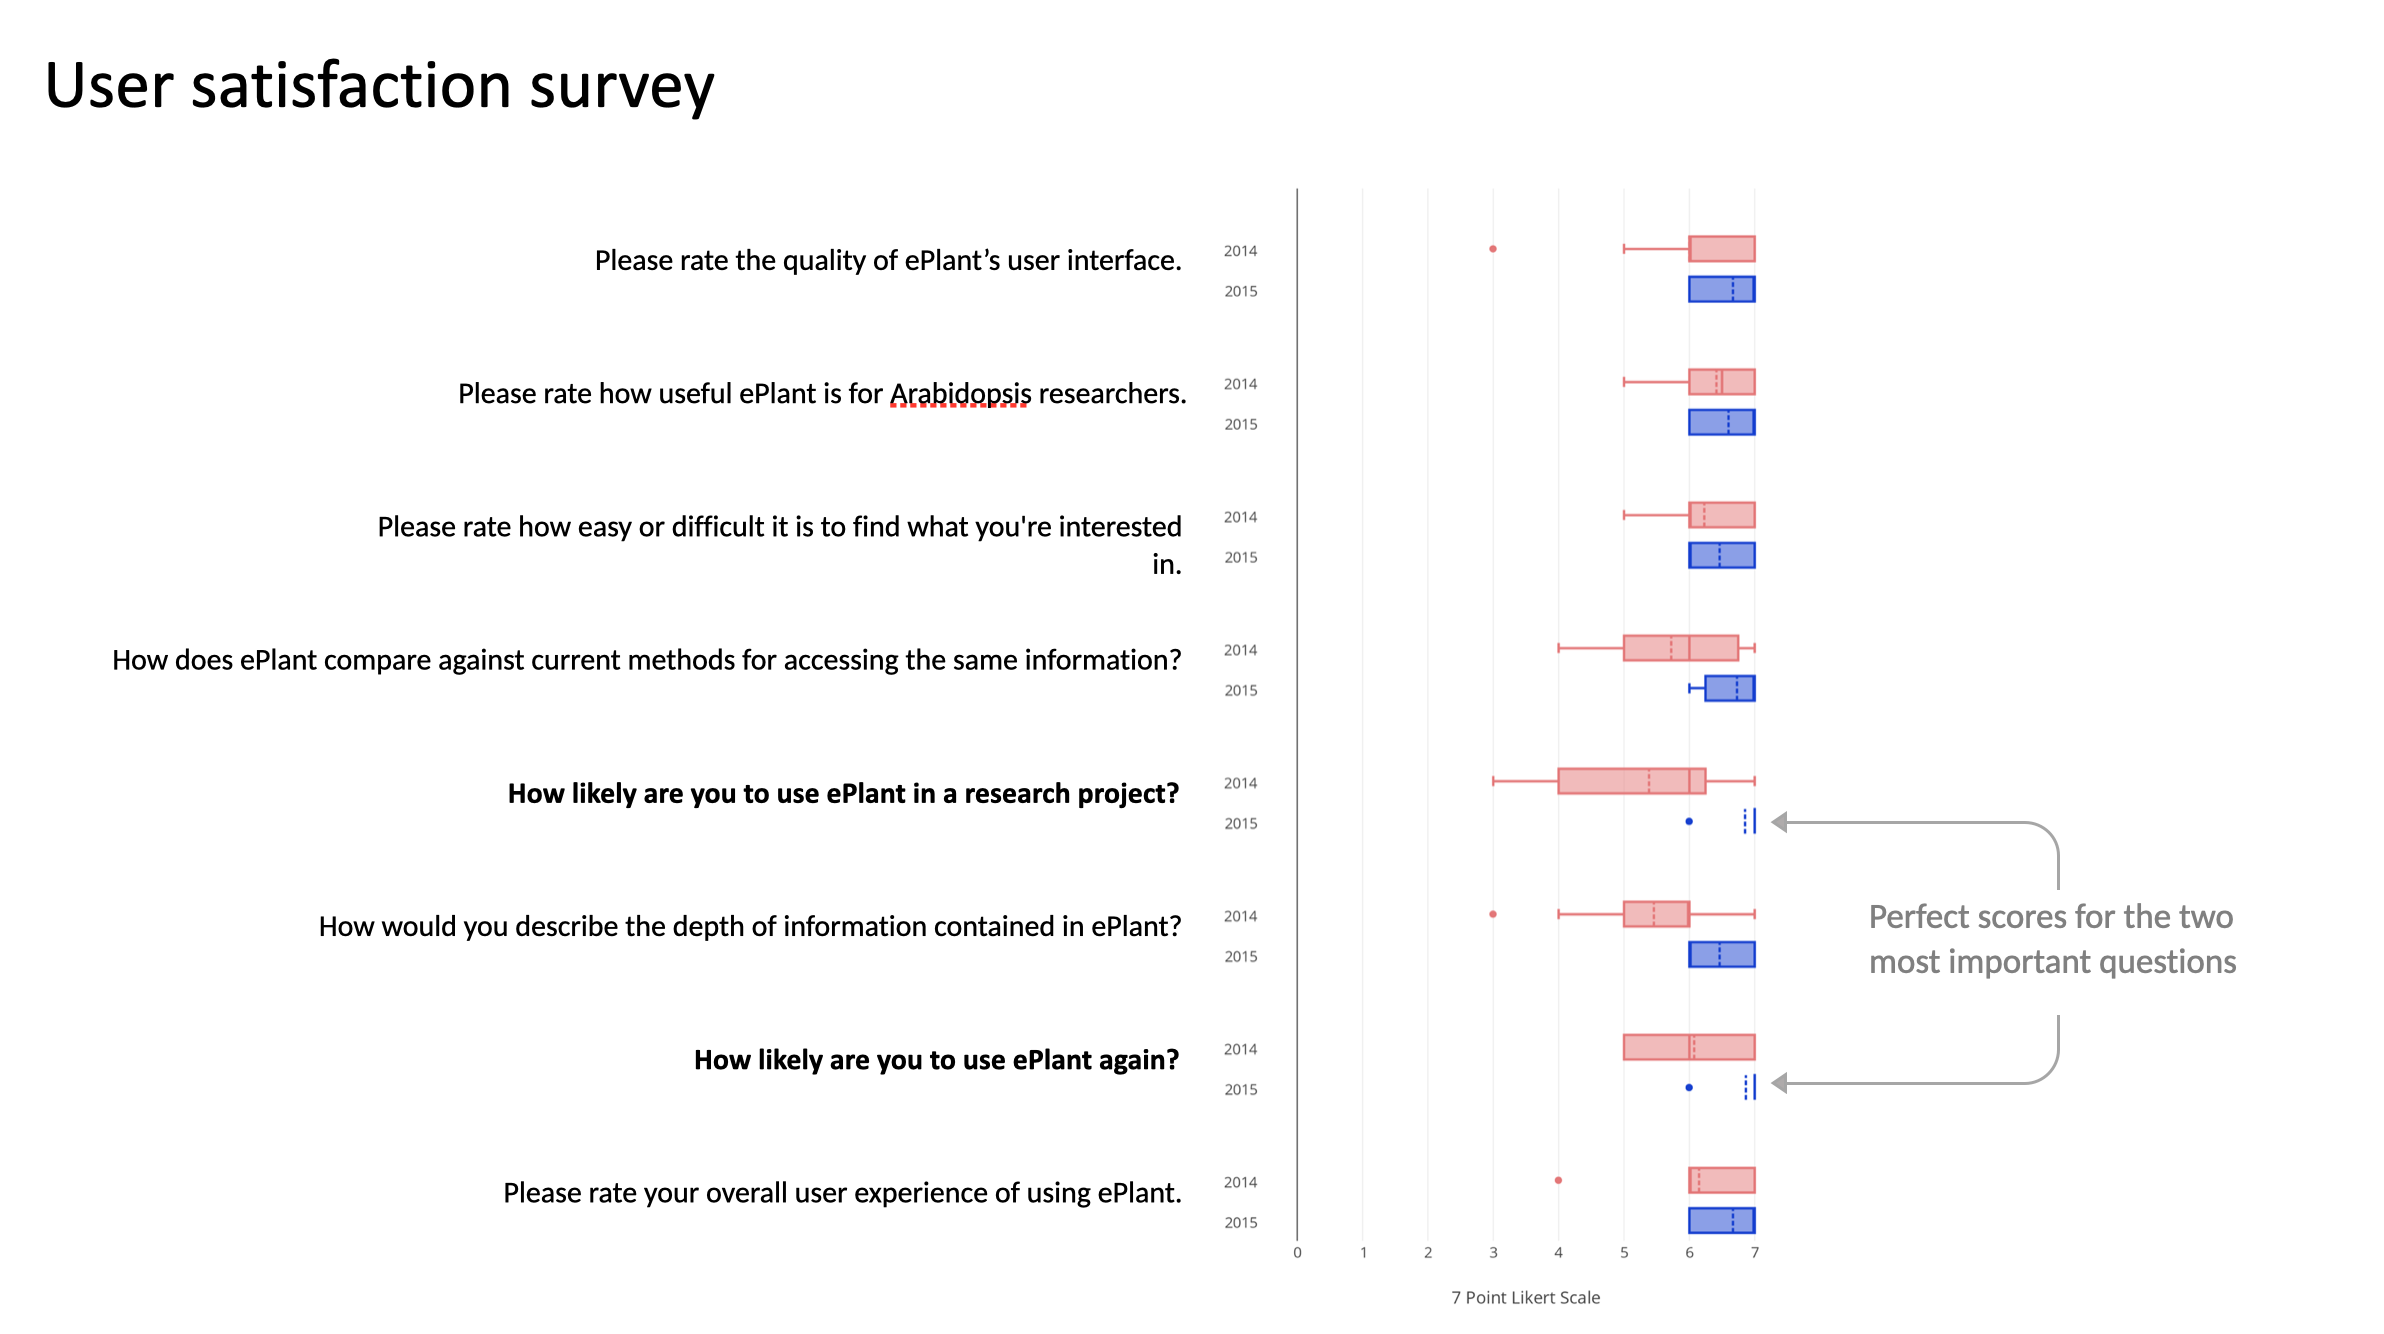
I rented booths at the 2014 and 2015 International Conference of Arabidopsis Research and offered people drink tickets in exchange for fifteen minutes of their time. This process is described more fully in the paper.
ICAR 2014 Vancouver
4 professors
2 post docs
5 PhD candidates
2 industry researchers
13 TOTAL
** Emerging Scientist Award
ICAR 2015 Paris
8 professors
1 post docs
3 PhD candidates
3 industry researchers
3 undeclared
18 TOTAL
** 15-minute preseantation to 350 people on the main stage
Impact
ePlant continues to get about 50,000 visitors per month. The average engagement per visit is 9.6 minutes. 20% of users spend more than 15 minutes on the site per visit. Users come from all over the world: USA, China and Japan are the top three.
(Data captured from AWS stats August 20, 2021)
Since ePlant Arabidopsis was released in 2016, my PhD supervisor, Nicholas Provart, has released fifteen ePlants for other species.
The finished product
ePlant was completed in 2016. It has been continuously updated by students in Nicholas Provart’s lab as well as by my sons, Ben and Alex. Try it here.
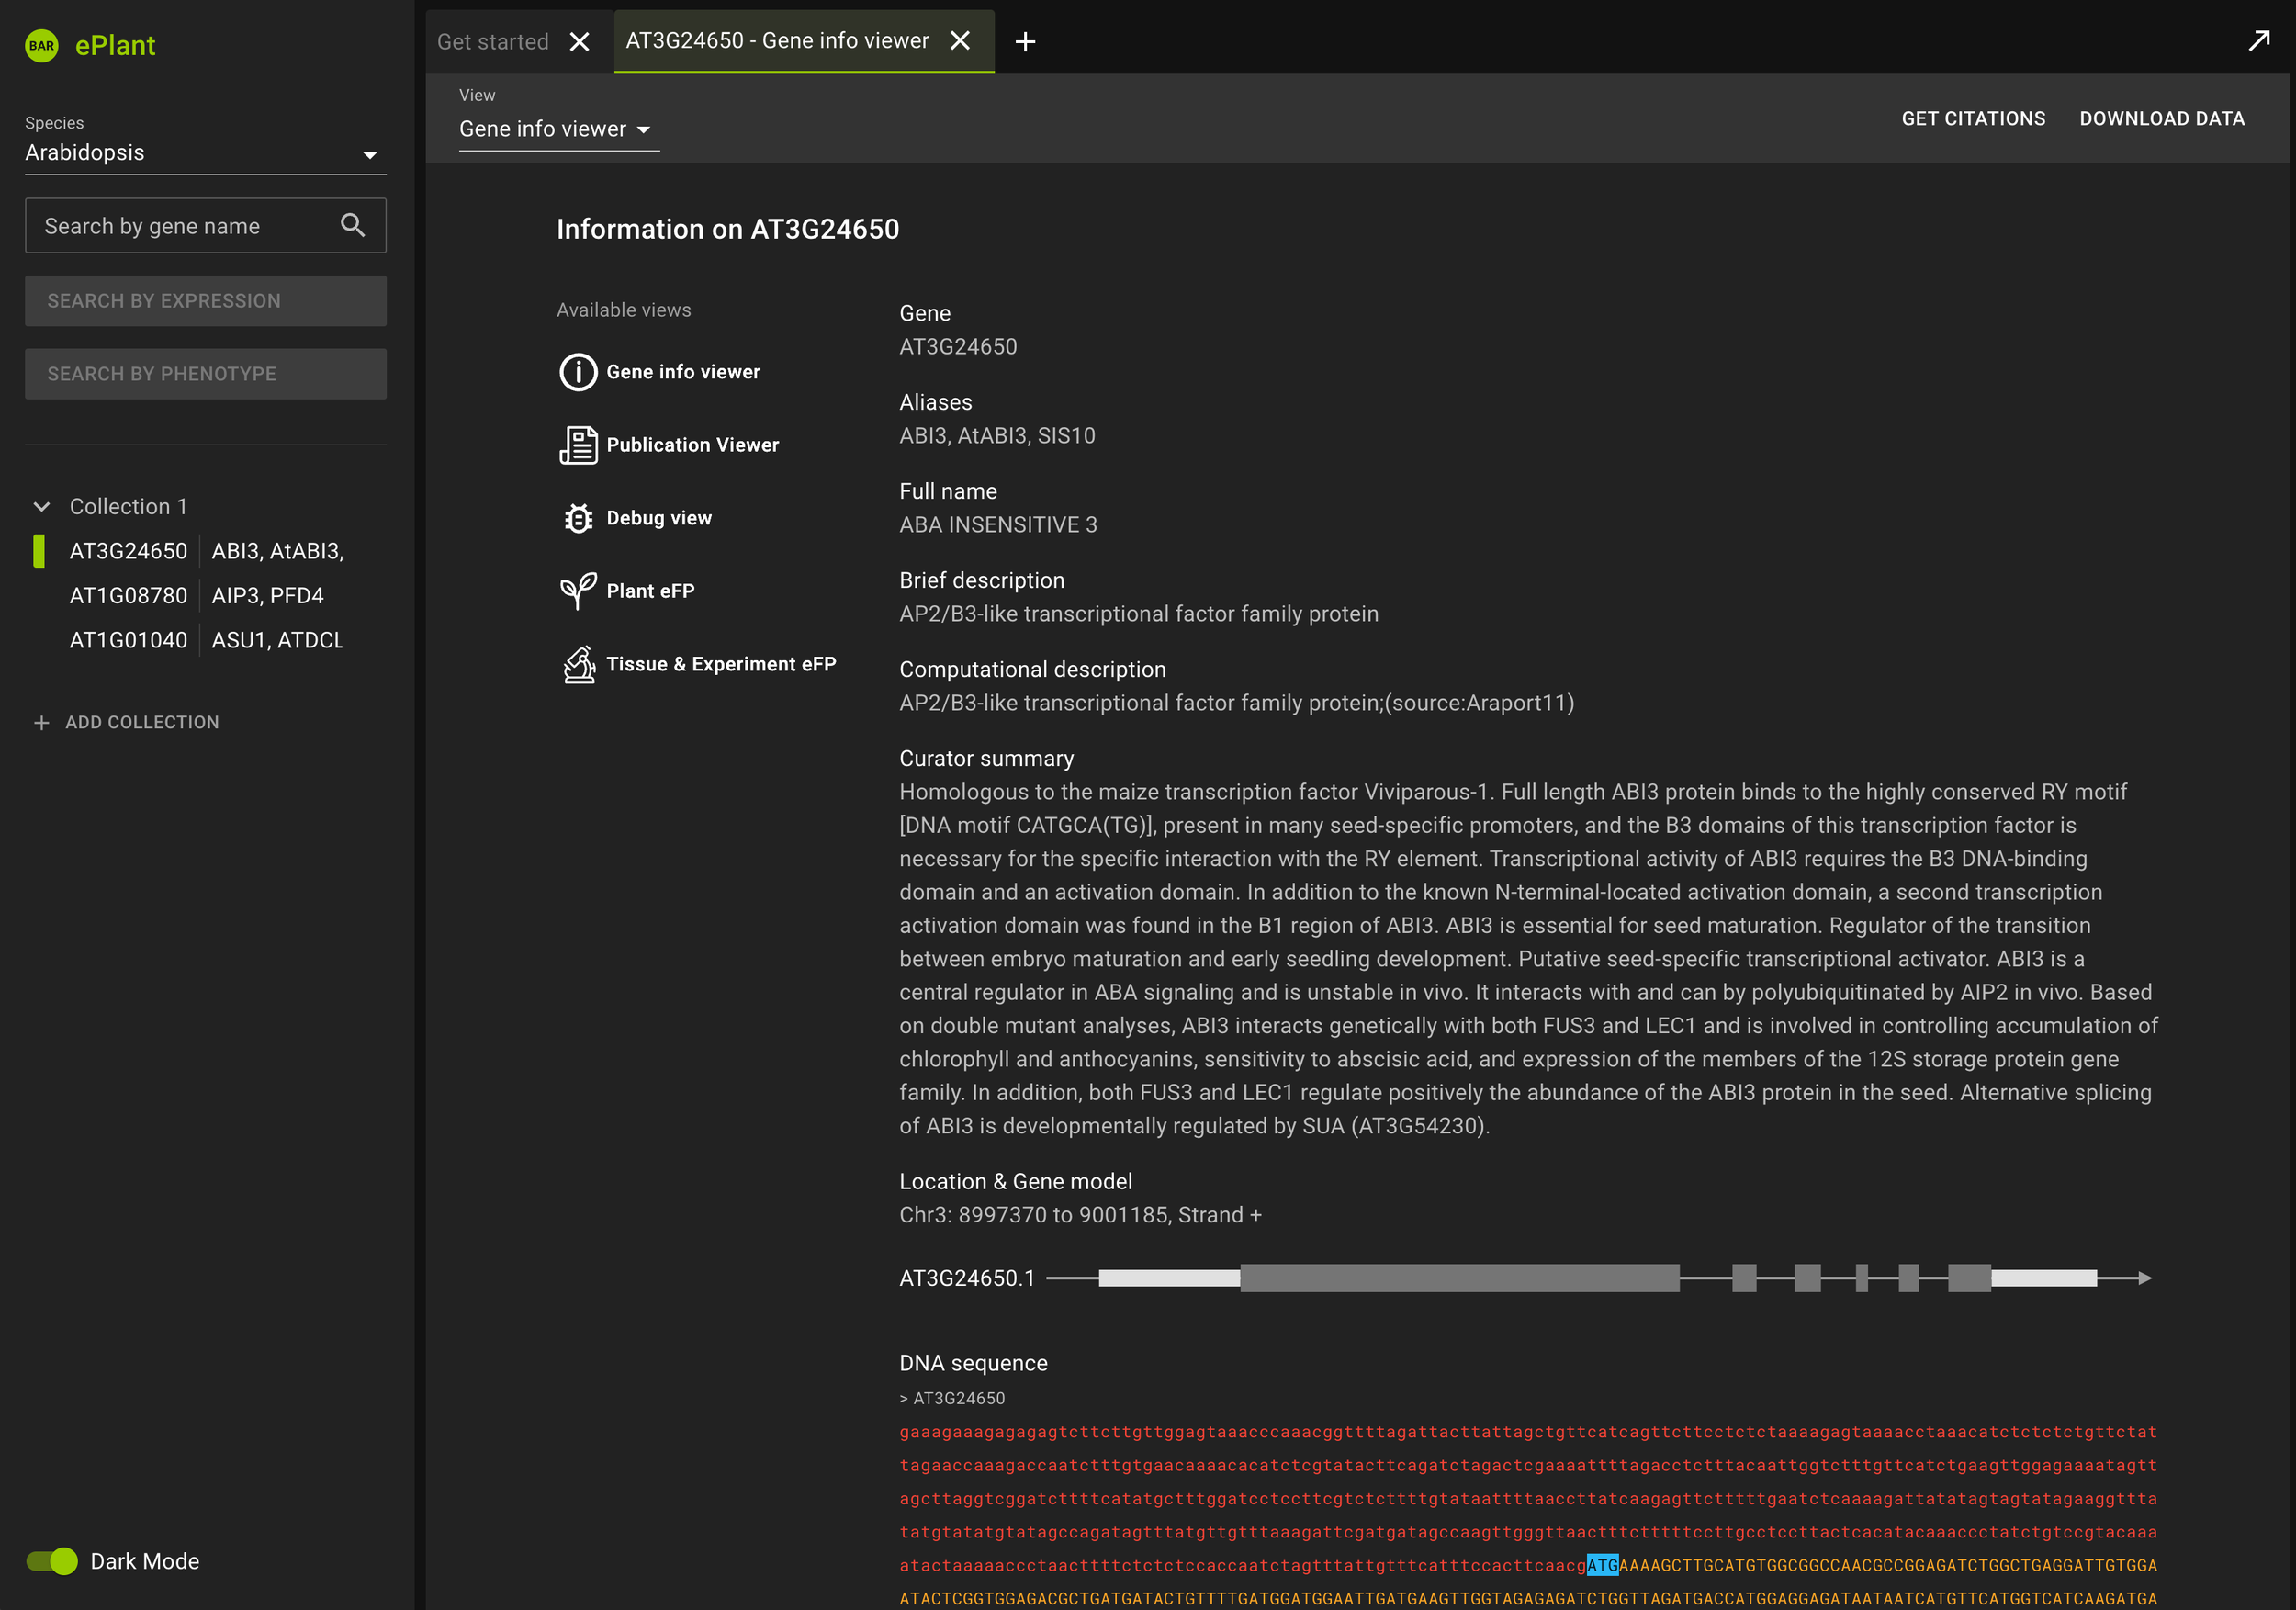
Alex is currently rebuilding it with React and we took the opportunity to update some of the design choices. What a delight to revisit my PhD project with my son! Here’s a sneak peak. I’ll post a link when he’s done.
