Expression Angler
My PhD supervisor, Nicholas Provart, created Expression Angler as part of the original collection of biological data visualization tools on the BAR. It calculated the correlation coefficients for all gene expression vectors as compared to whatever gene that a user enters. In other words, it helps users identify Arabidopsis genes with similar expression patterns to any gene of interest.
Unfortunately, the layout and messaging in the original tool made it very difficult to use. The interface was 100% text based and users needed to enter their query via a series of text boxes then scroll down several page lengths to find a ‘Submit Query’ button. It was a very powerful tool, but nobody was using it because they couldn’t understand how to interact with it.
A UX makeover
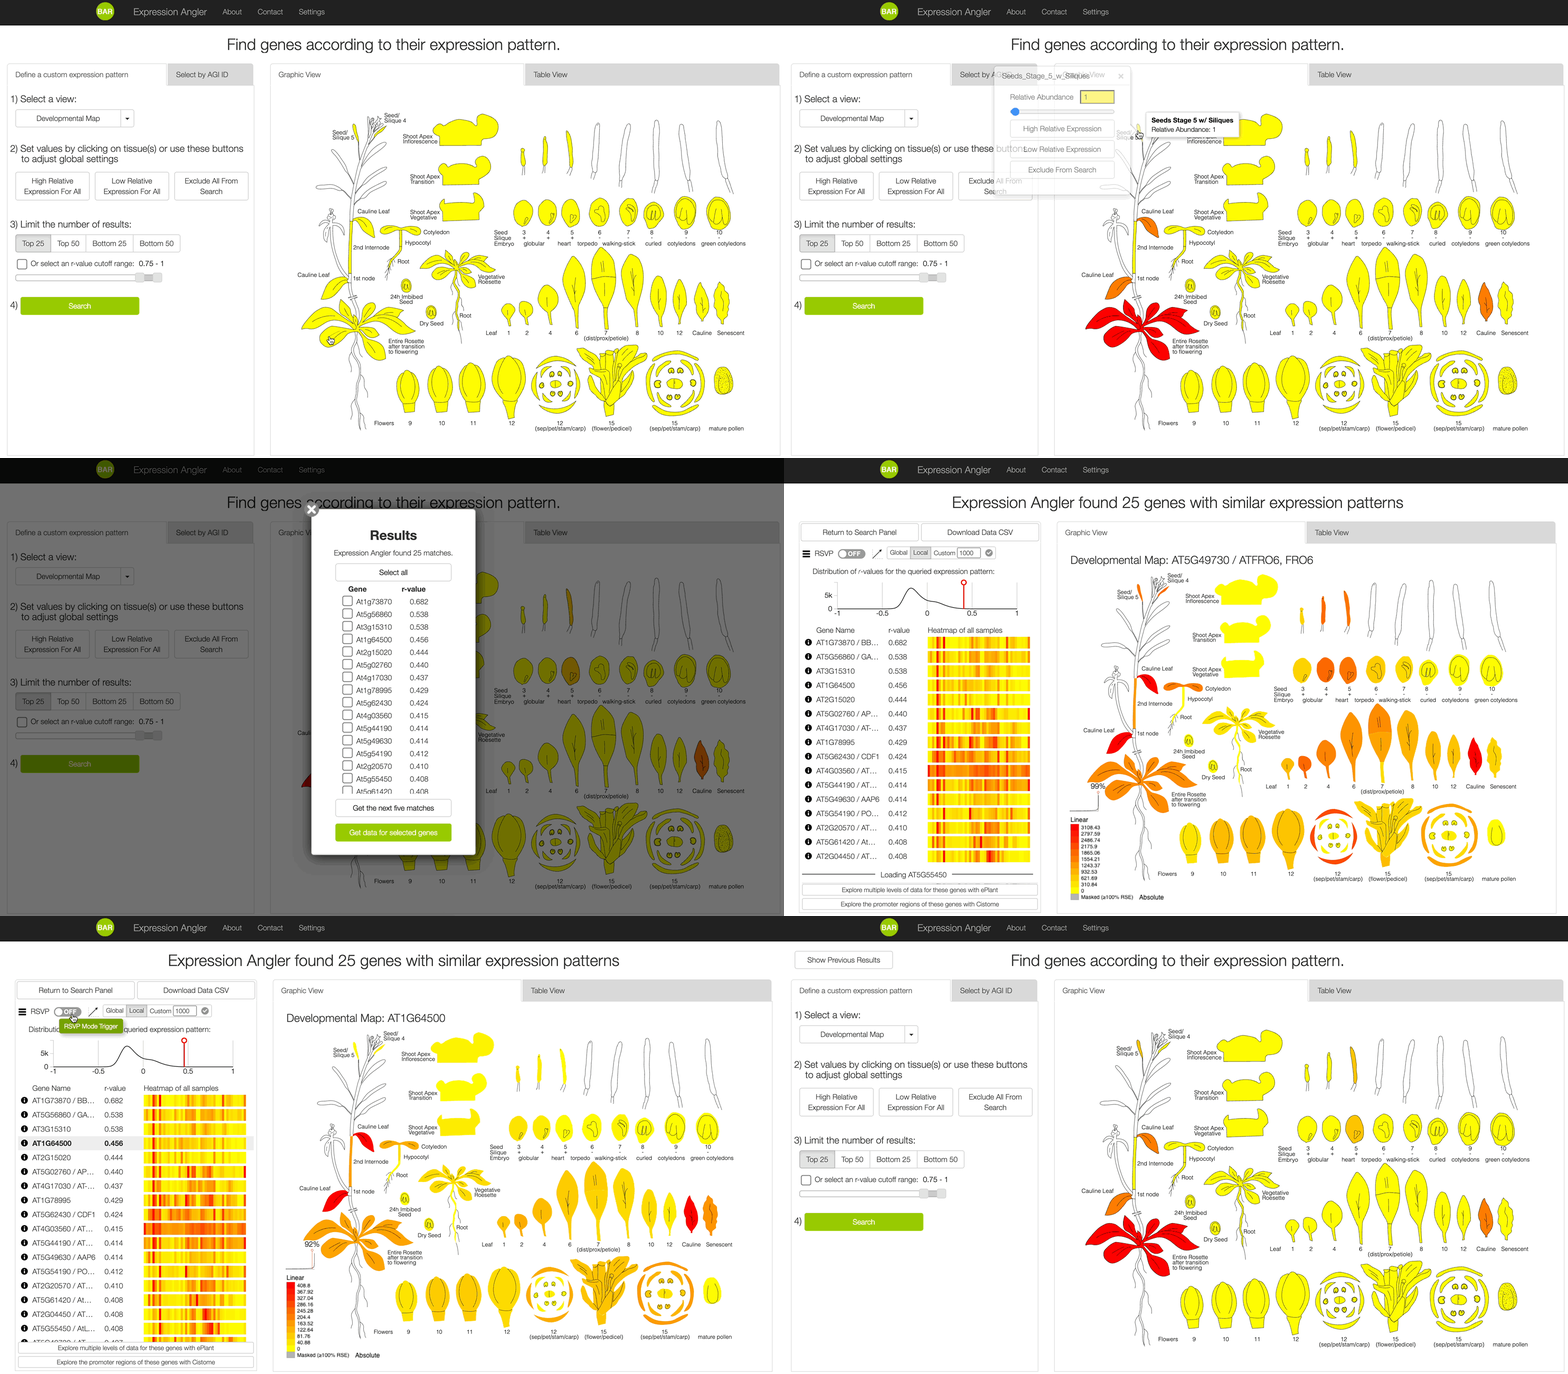
I redesigned the front-end of the tool with a more intuitive interface for selecting tissues. Users can now enter their search query by assigning hot or cold colors to a graphic representation of the tissues they are interested in.
Effectively, users can now “paint” an electronic fluorescent pictograph as a search query, and the tool then searches for genes that match it.
The new version of this tool is distributed as a standalone tool on the BAR and Araport. It is also included in the gene selection panel in ePlant.
It is described fully in "New BAR tools for mining expression data and exploring Cis-elements in Arabidopsis thaliana", published in The Plant Journal (Austin, Hiu, Waese ... Provart, 2016).
Read it here.
